Nick Hodge,
Publisher
May 19, 2023
Editor’s Note: What follows in the introduction to the May issue of Foundational Profits. It addresses the debt ceiling debacle and the risk it presents to your portfolio. The full issue goes over our current positioning, a new recommendation, and an update on all our portfolio positions. Click here to access the full issue.
—Nick

Earnings growth is still negative.
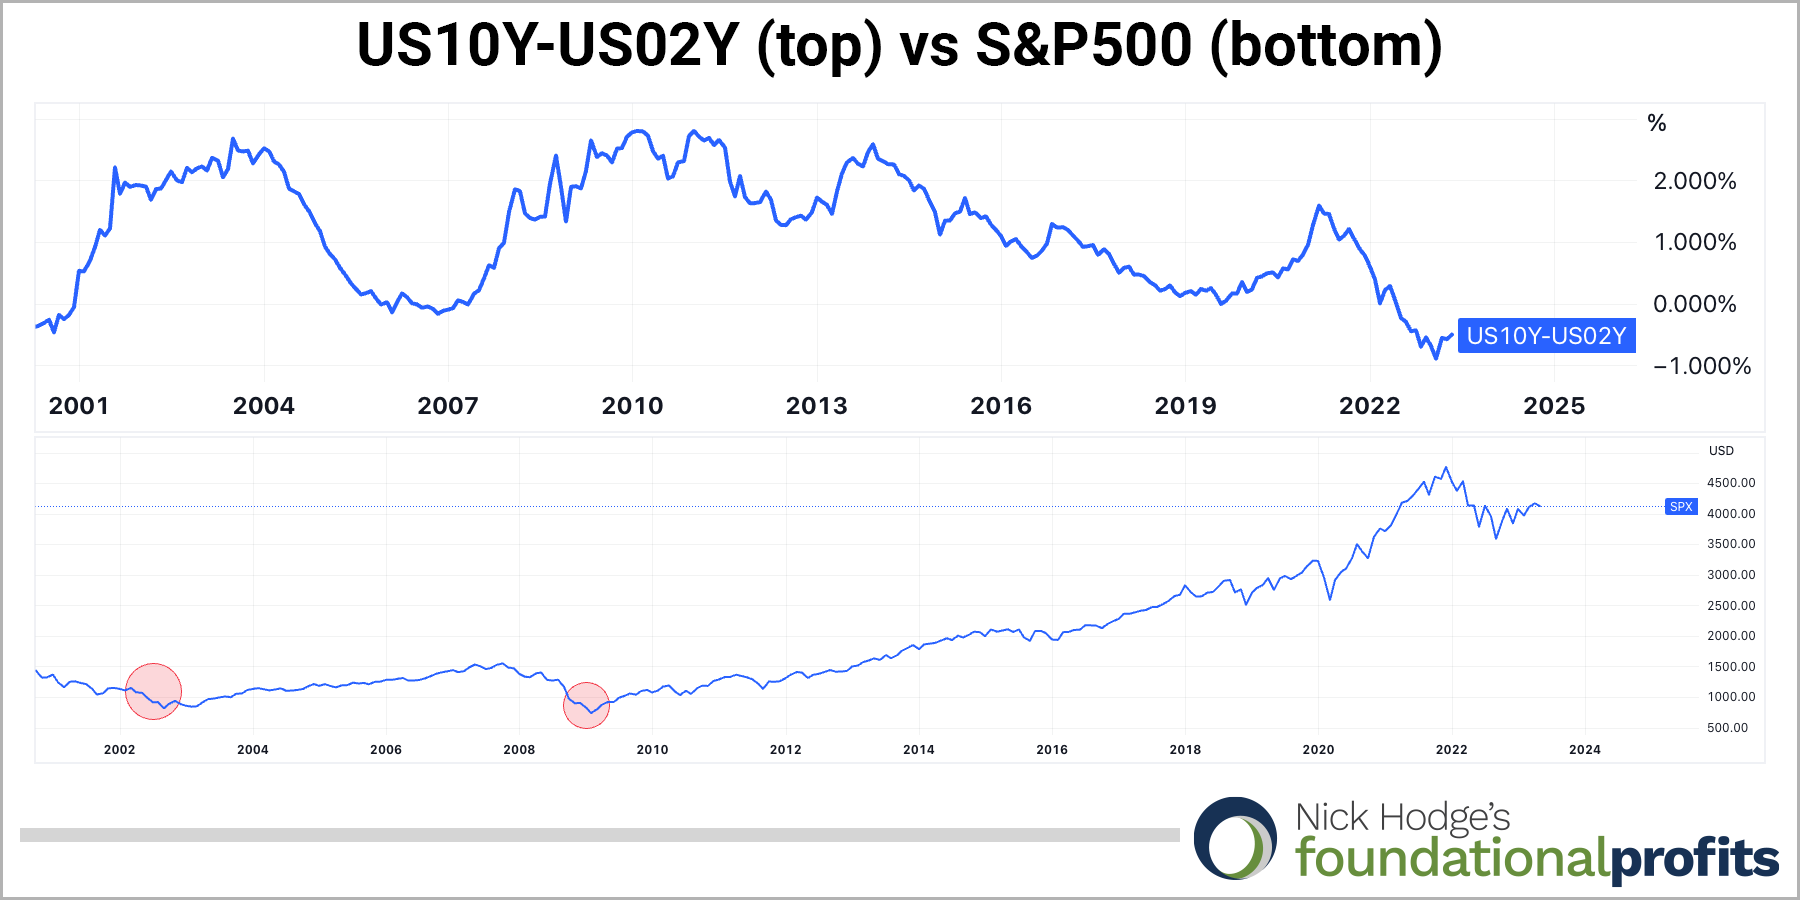
The yield curve is still inverted.
Bank failures this year are now larger than we saw in 2008.
And we have an imminent debt ceiling fight.
Check out our latest free research reports for in depth analysis on specific market trends.
View ReportsBulls continue to make their case by pointing to year-to-date stock market performance and a still-strong labor market. They don’t want to hear it when you tell them the S&P is still down 13% from its peak in January 2022 or that employment is a lagging indicator that is the last to go in recession.
As I’ve pointed out a few times, including in the January 2023 issue:
Higher rates affect housing first (check), then new orders (check), and then profits (we’re seeing that now). And when profits start to shrink, the pink slips commence, which is why employment is a lagging indicator. When unemployment starts ticking up, you can bet we’ve moved from mid-cycle to late cycle.
According to Piper Sandler, housing peaked in November 2020, orders in March 2021, and profits in June 2022. Employment would be the next shoe to drop, and the cycle can’t complete until it does.

But let’s step back and take the opening four sentences one by one.
1. Negative Earnings Growth - As of May 8, according to FactSet, “The blended (combines actual results for companies that have reported and estimated results for companies that have yet to report) earnings decline for the S&P 500 for Q1 2023 is -2.2%.” The NASDAQ 100 is even worse, with -10.16% earnings growth after 75 of the 100 companies reported.
2. Yield Curve Remains Inverted - The US10-Year yield minus the US02-Year yield is at -0.5 as of this writing, still worse than ahead of the 2001 Dotcom crash and the 2008 global financial crisis. And you should note that stocks really didn’t move significantly lower until after the curve uninverted.
3. Bank Failures Now Larger Than 2008 - Yields are one reason regional banks are in trouble, as bonds they previously bought are underwater at the same time customers are taking their cash out. In terms of total assets, the bank failures we’ve seen so far this year are already larger than we saw in 2008, with the assets of First Republic Bank, Silicon Valley Bank, and Signature bank totalling over $532 billion.

The SPDR S&P Regional Banking ETF has lost nearly half its value since February. The uncertainty that creates is good for gold and so is the cash leaving the banks that’s looking for a new home. And as I explained in last month’s issue, smaller banks “remain at risk given ongoing tightening and liquidity concerns.”
Check out our premium publications for more trading recommendations and exclusive coverage on the markets.
View Publications4. Imminent Debt Ceiling Fight - Some market participants aren’t taking this seriously because Congress has historically raised the debt ceiling with or without accompanying political puffery. Anecdotally, the political climate is much different right now than it has been historically. I think people are forgetting it took 15 rounds of voting just to elect the most recent Speaker of the House. Qualitatively, the cost of insuring against a default has recently been rising to superlative levels. According to the Financial Times on April 22:
The price of insuring against a US government default rose to a fresh high this week as traders began pricing in their concerns that the world’s biggest economy might not meet its financial obligations.
One-year US credit default swaps — derivatives that act like insurance and pay out if a company, or country, reneges on its borrowings in the next 12 months — are trading at 106 basis points, Bloomberg data shows.
That is its highest level since at least 2008, up from 15 basis points at the start of the year, and far in excess of 2011 levels, when a stand-off in Washington over the US debt ceiling led to the country losing its top-notch triple-A credit rating.
Indeed, the price of five-year credit default swaps — the most widely traded form of debt insurance — also reached its highest level in more than a decade this month, at 50 basis points.
Lower than expected April tax revenues have only heightened those concerns, dragging forward the so-called “X-date” when the US Treasury runs out of money.

That “X-date” could be as soon as later this month.
See how we’re positioning for it in this month’s issue of Foundational Profits.

Nick Hodge
Publisher, Daily Profit Cycle